

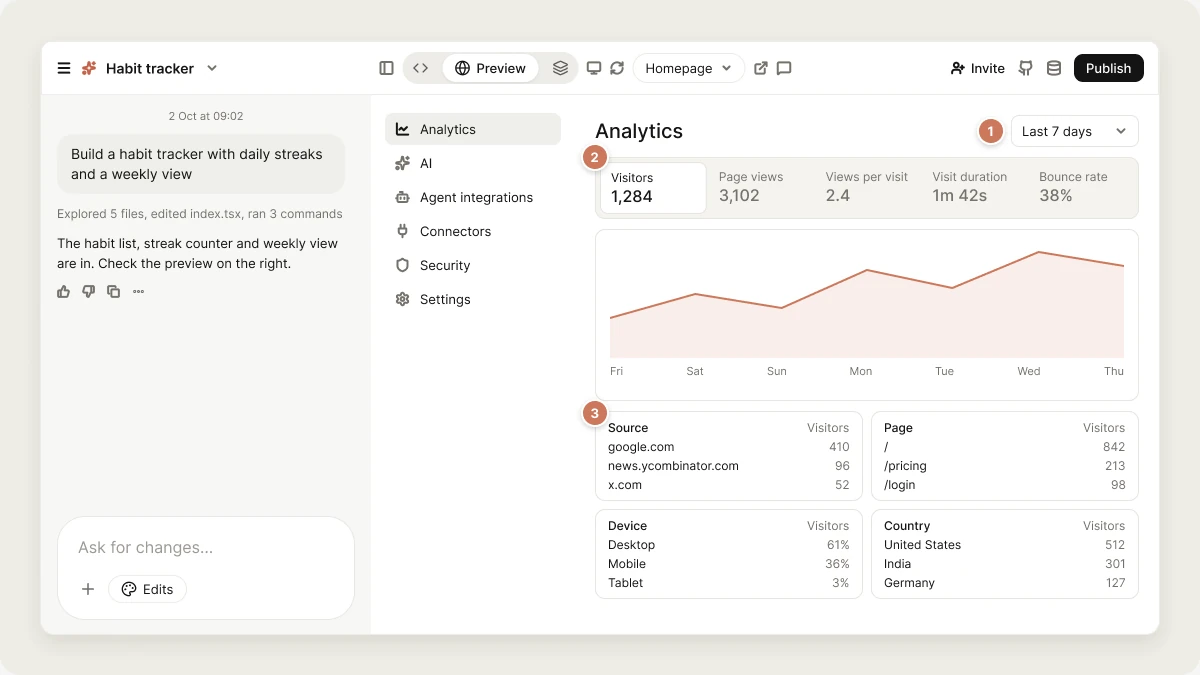
Analytics is available for published web apps, on every plan. Data is collected only while the project is published. Until then, the view says “To view analytics, you first need to publish your project.”
Time periods
Analytics shows the last 7 days by default. Use the dropdown at the top to choose another period:- Today
- Yesterday
- Last 24 hours
- Last 7 days (default)
- Last 14 days
- Last 30 days
- Last 90 days
- This month
Metrics
The top of the view shows four totals for the selected period:- Visitors: how many people visited your app.
- Pageviews: how many pages they viewed in total.
- Bounce rate: the share of visits that viewed only one page.
- Avg. visit duration: how long the average visit lasted.
Breakdowns
Below the chart, lists break down your traffic for the selected period:- Top pages: your most viewed pages.
- Top sources: the sites visitors came from, such as a search engine or a link on another site.
- Devices: desktop, mobile or tablet.
- Countries: where your visitors are.
- Campaigns: the
utm_sourceof tagged links, like?utm_source=newsletter, so you can see which campaign brought people in.
For funnels, events inside your app, or product analytics, add a dedicated tool. See Analytics connectors.
Privacy
Analytics measures overall traffic, not individual people:- No cookies are set, so you don’t need a cookie banner for Vibely analytics.
- Visitors are counted with an anonymous identifier that changes every day, so people can’t be followed across days. IP addresses aren’t stored.
- Raw visit data is deleted after 90 days.
Turn analytics off
To stop collecting visits for a project, turn on Disable analytics in Project settings. Your published app stops loading the Vibely analytics script, and visits are no longer recorded. It takes effect on the live site within about a minute, without republishing. Data already collected stays in the view until it ages out; turn the setting off again to resume counting. Disabling analytics doesn’t turn off error monitoring: errors your visitors hit are still reported.Use analytics from an AI assistant
If you use the Vibely MCP server, assistants like Claude and ChatGPT can read your analytics too, for example “How many visitors did my app get this week, and where did they come from?”FAQ
Why don't I see any data?
Why don't I see any data?
Analytics only counts visits to your published app, not the preview in the editor. Check that the project is published, that Disable analytics is off in Project settings, and share the link. The view shows “No analytics yet” until the first visit arrives.
Do my own visits count?
Do my own visits count?
Yes. Visits to the published URL count, including yours.
Can I track mobile apps?
Can I track mobile apps?
Analytics covers published web apps. For mobile apps, use App Store Connect and Play Console analytics, or add an analytics connector.
Related
Publish
Put your app live to start collecting data.
SEO and AI search
Bring more visitors from search.
Analytics connectors
Product analytics and event tracking.
Workspace insights
How your whole workspace builds.